Concepts
This page explains the main concepts in QMonitor. Understanding these terms will help you set up and use QMonitor successfully.
Organization
An organization is a container for monitored SQL Server instances and the users who manage them.
graph TB
    OrgA["<br>Organization A<br><br>"]

    Owner["Owner User<br>👤<br>(Full Access)"]
    User1["Regular User<br>👤<br>(View Only)"]
    User2["Regular User<br>👤<br>(View Only)"]

    spacer1[" "]:::spacer
    spacer2[" "]:::spacer

    Agent1["Agent<br>Data Center 1"]
    Agent2["Agent<br>Data Center 2"]

    Instance1["SQL Server<br>Instance 1"]
    Instance2["SQL Server<br>Instance 2"]
    Instance3["SQL Server<br>Instance 3"]
    Instance4["SQL Server<br>Instance 4"]

    OrgA --> Owner
    OrgA --> User1
    OrgA --> User2

    OrgA ~~~ spacer1
    spacer1 ~~~ spacer2

    OrgA --> Agent1
    OrgA --> Agent2

    Agent1 --> Instance1
    Agent1 --> Instance2
    Agent2 --> Instance3
    Agent2 --> Instance4

    style OrgA fill:#4A90E2,stroke:#2E5C8A,stroke-width:3px,color:#fff
    style Owner fill:#52C41A,stroke:#389E0D,stroke-width:2px,color:#fff
    style User1 fill:#1890FF,stroke:#096DD9,stroke-width:2px,color:#fff
    style User2 fill:#1890FF,stroke:#096DD9,stroke-width:2px,color:#fff
    style Agent1 fill:#FA8C16,stroke:#D46B08,stroke-width:2px,color:#fff
    style Agent2 fill:#FA8C16,stroke:#D46B08,stroke-width:2px,color:#fff
    style Instance1 fill:#722ED1,stroke:#531DAB,stroke-width:2px,color:#fff
    style Instance2 fill:#722ED1,stroke:#531DAB,stroke-width:2px,color:#fff
    style Instance3 fill:#722ED1,stroke:#531DAB,stroke-width:2px,color:#fff
    style Instance4 fill:#722ED1,stroke:#531DAB,stroke-width:2px,color:#fff
classDef spacer fill:#fff,stroke:#fff- When you first sign up for QMonitor, you are not part of any organization
- You can create a new organization or join an existing one
- The user who creates an organization becomes its owner
- Owners can invite users and manage all organization settings
- Regular users can only view data (they cannot change settings)
- Users can belong to multiple organizations with different roles
- All users in an organization can access data from all SQL Server instances registered in that organization
- If you have different teams working on different sets of instances, create separate organizations for each team
User
A User is a registered account identified by an email address. Users can join multiple organizations and have different roles in each organization.
graph LR
    User["👤<br><br>User<br>user@example.com<br><br>"]

    OrgA["<br>Organization A<br><br>"]
    OrgB["<br>Organization B<br><br>"]
    OrgC["<br>Organization C<br><br>"]

    RoleA["Role: Owner<br>(Full Access)"]
    RoleB["Role: Regular User<br>(View Only)"]
    RoleC["Role: Regular User<br>(View Only)"]

    User --> OrgA
    User --> OrgB
    User --> OrgC

    OrgA --> RoleA
    OrgB --> RoleB
    OrgC --> RoleC

    style User fill:#FA541C,stroke:#D4380D,stroke-width:3px,color:#fff
    style OrgA fill:#4A90E2,stroke:#2E5C8A,stroke-width:3px,color:#fff
    style OrgB fill:#4A90E2,stroke:#2E5C8A,stroke-width:3px,color:#fff
    style OrgC fill:#4A90E2,stroke:#2E5C8A,stroke-width:3px,color:#fff
    style RoleA fill:#52C41A,stroke:#389E0D,stroke-width:2px,color:#fff
    style RoleB fill:#1890FF,stroke:#096DD9,stroke-width:2px,color:#fff
    style RoleC fill:#1890FF,stroke:#096DD9,stroke-width:2px,color:#fff
Instance
An Instance represents a SQL Server instance registered in an organization. QMonitor connects to the Instance using the connection string you provide. The connection string includes the authentication method. See the Authentication section for supported methods.
Agent
An Agent is a service that collects metrics from SQL Server instances.
- The Agent is installed as a service on a computer in your network
- The Agent connects to SQL Server instances assigned to it
- If you have multiple data centers, create separate Agents for each location
- Each Agent monitors the instances in its data center
This structure keeps monitoring traffic local and improves reliability.
Monitoring Concepts
QMonitor continuously collects and displays performance data from your SQL Server instances. Understanding these monitoring concepts will help you interpret the data and respond to problems effectively.
Dashboard
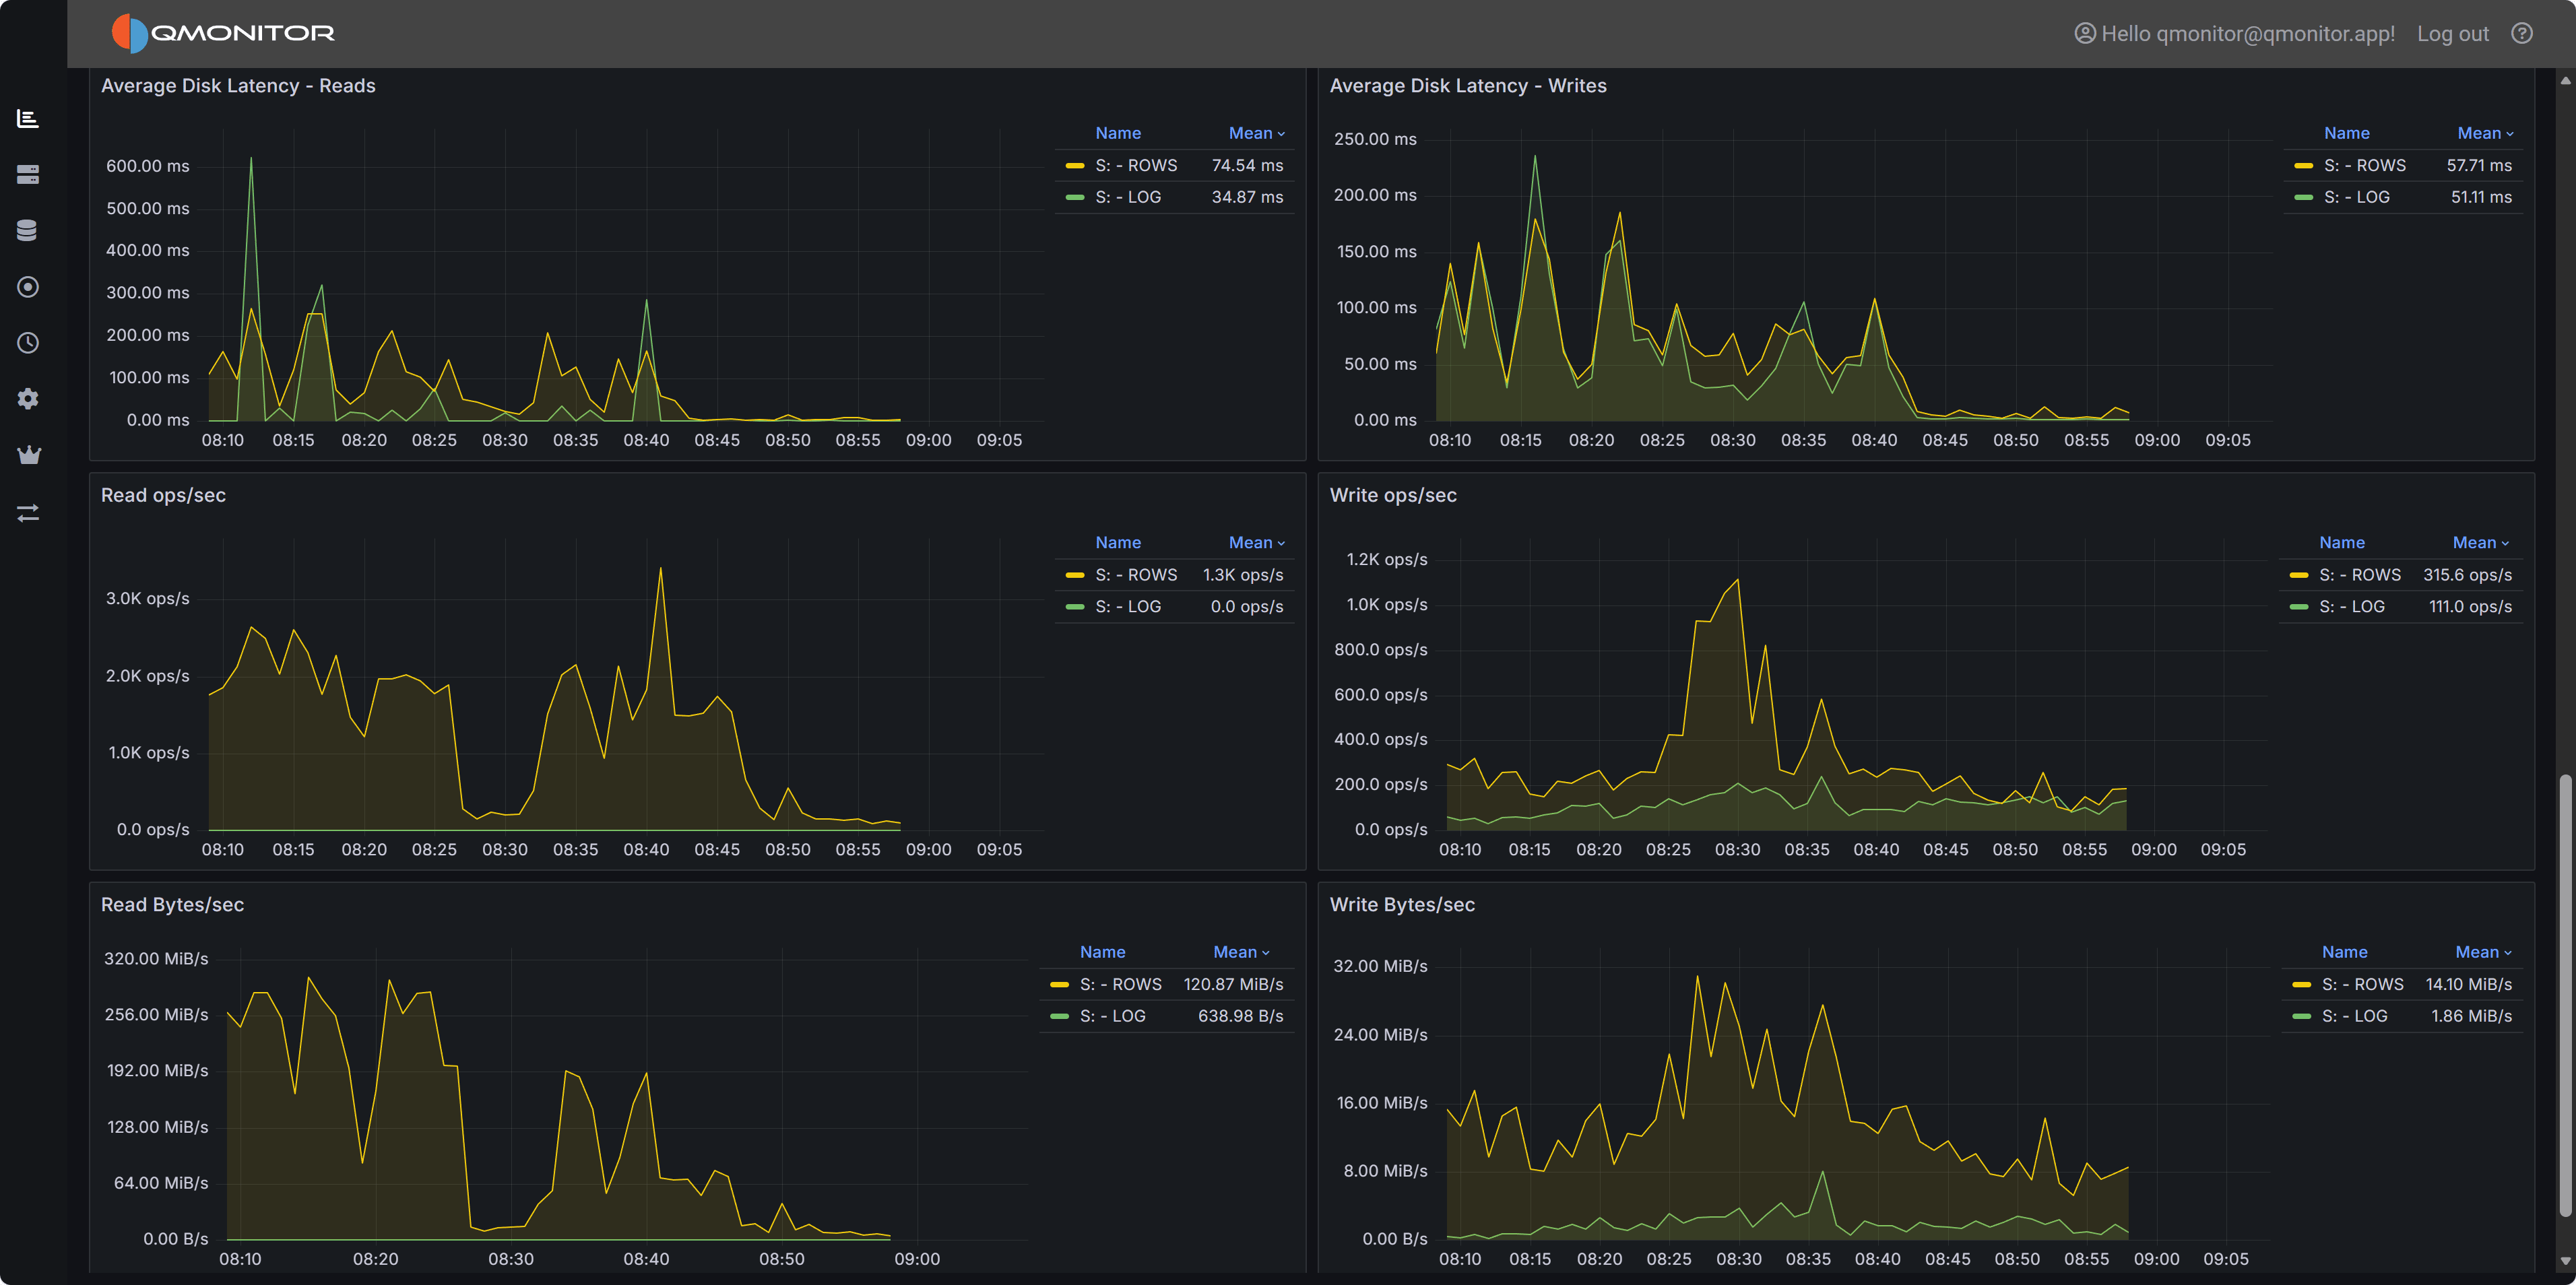
A Dashboard is a customizable view that displays metrics from one or more SQL Server instances in real-time.
- Each organization has a set of standard Dashboards
- Dashboards contain widgets that visualize different metrics
- Dashboards update automatically as new data arrives
- All users in an organization can view Dashboards
Here is an example of a Dashboard showing disk metrics for a particular instance:
Metric
A Metric is a specific measurement collected from a SQL Server instance at regular intervals.
Examples of metrics:
- CPU usage percentage
- Memory consumption
- Database size
- Active connections
- Query execution time
- Disk I/O operations
Each metric has:
- Current value - The most recent measurement
- Historical data - Past values stored for trend analysis
- Thresholds - Optional warning and critical levels
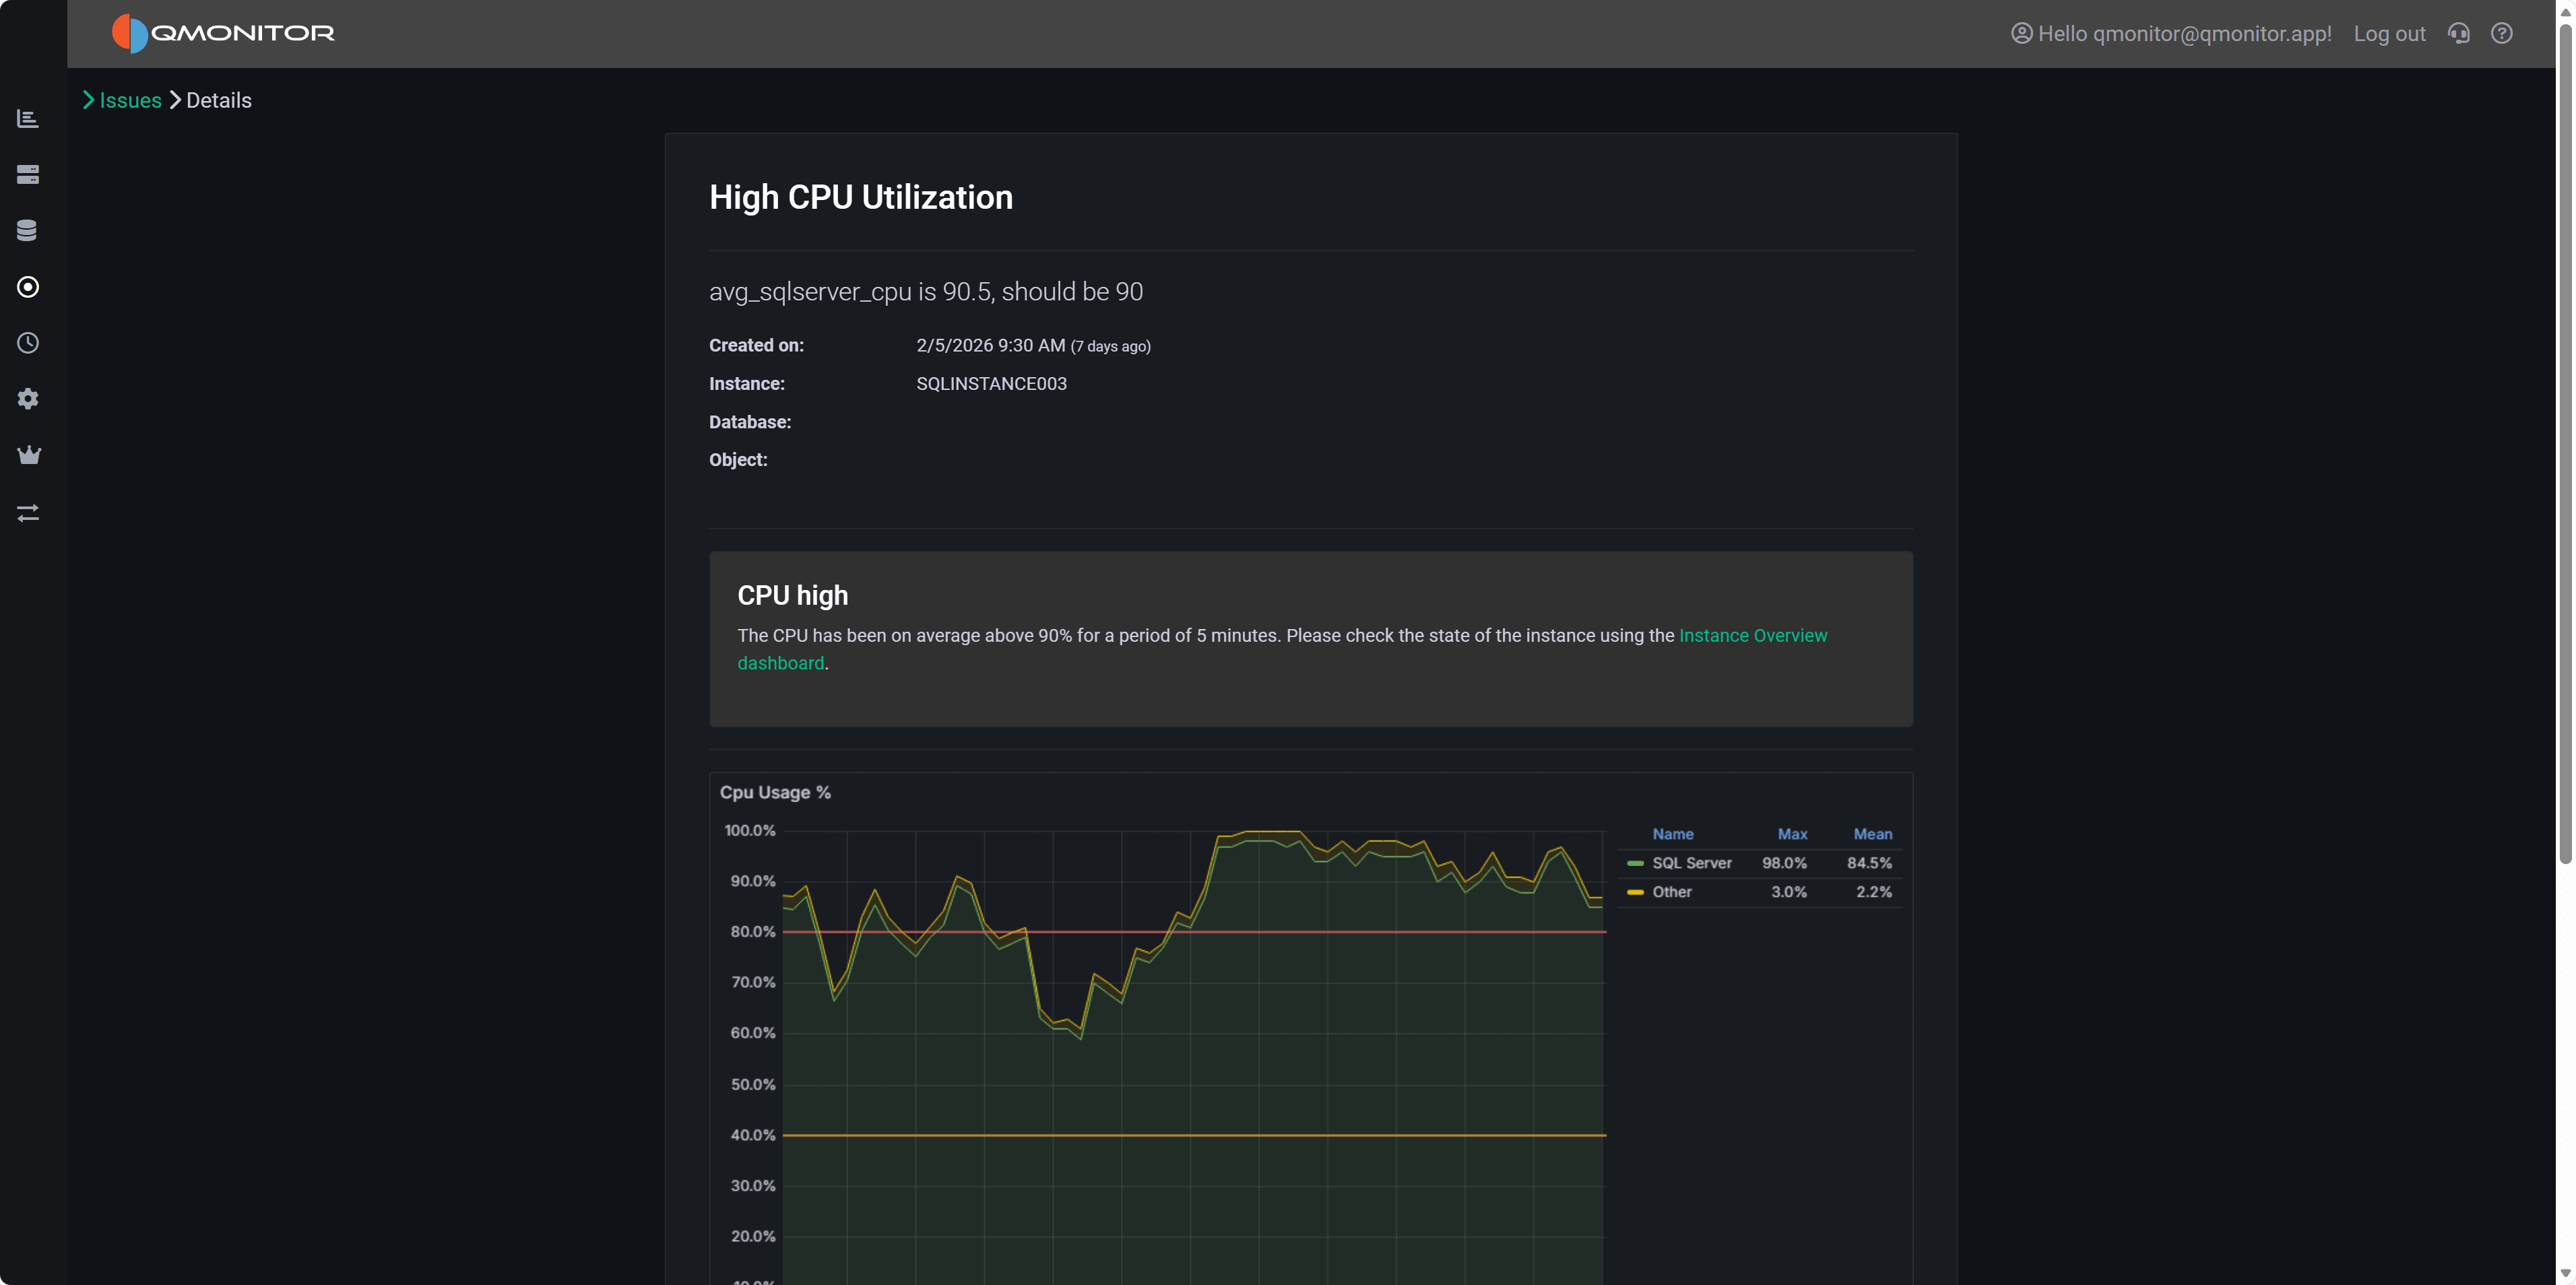
Issue
An Issue is an alert generated when a metric crosses a defined threshold or when QMonitor detects an abnormal condition.
Issue lifecycle:
- Open - The condition that causes the Issue is detected
- Active - The Issue remains active while the condition persists
- Closed - The condition returns to normal
Notifications:
- QMonitor can send notifications when Issues are triggered
- Notification methods include email, Teams, Slack, Telegram, or other integrations (see the Notifications section)
- Only organization Owners can configure Issue thresholds and notification settings
Here is an example of an Issue triggered by high CPU usage: